Tabulated data

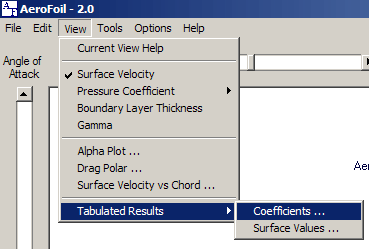
Two different displays of tabulated data are available; these are coefficients and surface values.
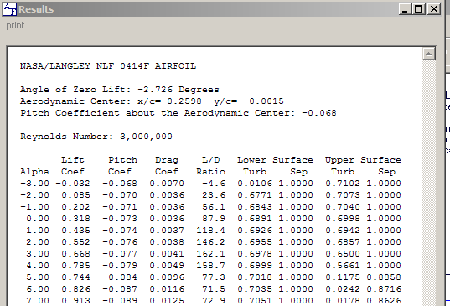
The coefficient display shows the following information:
|
Angle of Zero Lift
Aerodynamic Center
Pitch Coefficient about the aerodynamic center
Reynolds Number
Angle of Attack
Lift Coefficient
Pitch Coefficient
If viscous effects are included:
Drag Coefficient
Chord location, in terms of x/c, of transition points from:
- Laminar flow to turbulent flow
- Turbulent flow to separation
- lift-to-drag ratio
|

|
The surface value display shows the following:
- The X and Y coodinate points which define the airfoil,
- The surface velocity, pressure coefficient,
- and the boundary layer thickness (if viscous effects are included) at each point.
These values are a linear interpolation at the selected angle of attack. A negative value of surface velocity represents flow which is below the stagnation point and is passing below the airfoil.


